Africa’s Solar Boom May Be Hiding In The Import Data
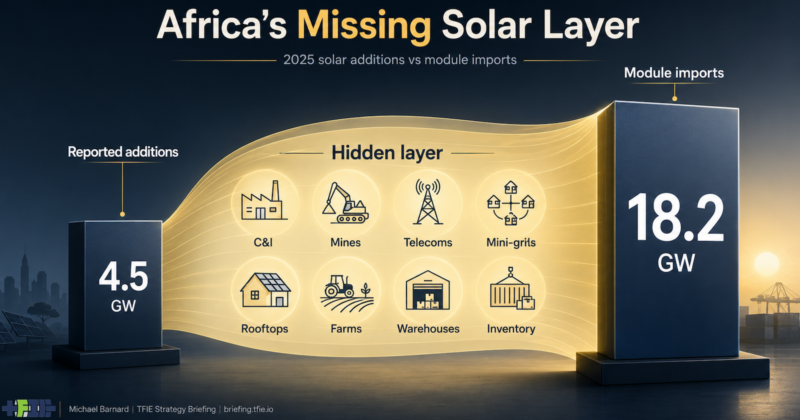 ChatGPT generated infographic showing the gap between Africa’s reported solar additions and module imports, where much of the real market may be hiding.
May 27, 20263 hours
Michael Barnard
0 Comments
Support CleanTechnica's work through a Substack subscription or on Stripe.
ChatGPT generated infographic showing the gap between Africa’s reported solar additions and module imports, where much of the real market may be hiding.
May 27, 20263 hours
Michael Barnard
0 Comments
Support CleanTechnica's work through a Substack subscription or on Stripe.
At the start of 2026, I predicted that Africa would surprise a lot of observers with solar deployment this year. That was in my 2026 energy predictions article, and the prediction was not based on one giant solar park, one government announcement, or one development bank programme. It was based on a set of conditions that were starting to reinforce one another.
Cheap Chinese solar modules were looking for markets. Batteries were getting cheaper. African grids in many countries remained weak, unreliable, or incomplete. Diesel was still expensive. Mines, telecoms, warehouses, farms, factories, clinics, schools, and households all had practical reasons to want electricity that did not depend entirely on the grid or fuel trucks. At the same time, African trade integration, Chinese-built logistics corridors, ports, roads, rail, and local business networks were making it easier for physical hardware to move.
That was also the argument in my earlier Africa clean-energy flywheel article. The core idea was simple enough. Solar and storage imports lower the cost of reliable electricity. Better logistics move the equipment inland. The African Continental Free Trade Area makes cross-border trade and larger markets more plausible. Electrified transport creates new demand for electricity and batteries. Industrial development follows cheaper and more reliable power. Better markets reward better governance. None of that is guaranteed, but the pieces fit together better than most people outside the continent seem to notice.
The new data does not prove the thesis yet. It does something more useful. It tells us where to look.
The headline number going around is that Africa added a record 11.3 GW of renewable capacity in 2025, three times the prior year. That is a meaningful number. It is also easy to misuse. It is not a solar number. Large hydro and wind projects are doing real work in that total, and anyone who treats 11.3 GW of renewables as 11.3 GW of solar is already most of the way to a bad conclusion.
The solar-specific number is smaller, but more interesting. The Global Solar Council says Africa installed about 4.5 GW of new solar PV in 2025, up 54% year over year. That is not remotely India-scale. It is not Brazil-scale either. But the same assessment says Africa imported 18.2 GW of solar modules in 2025. That gap is where the story gets interesting.
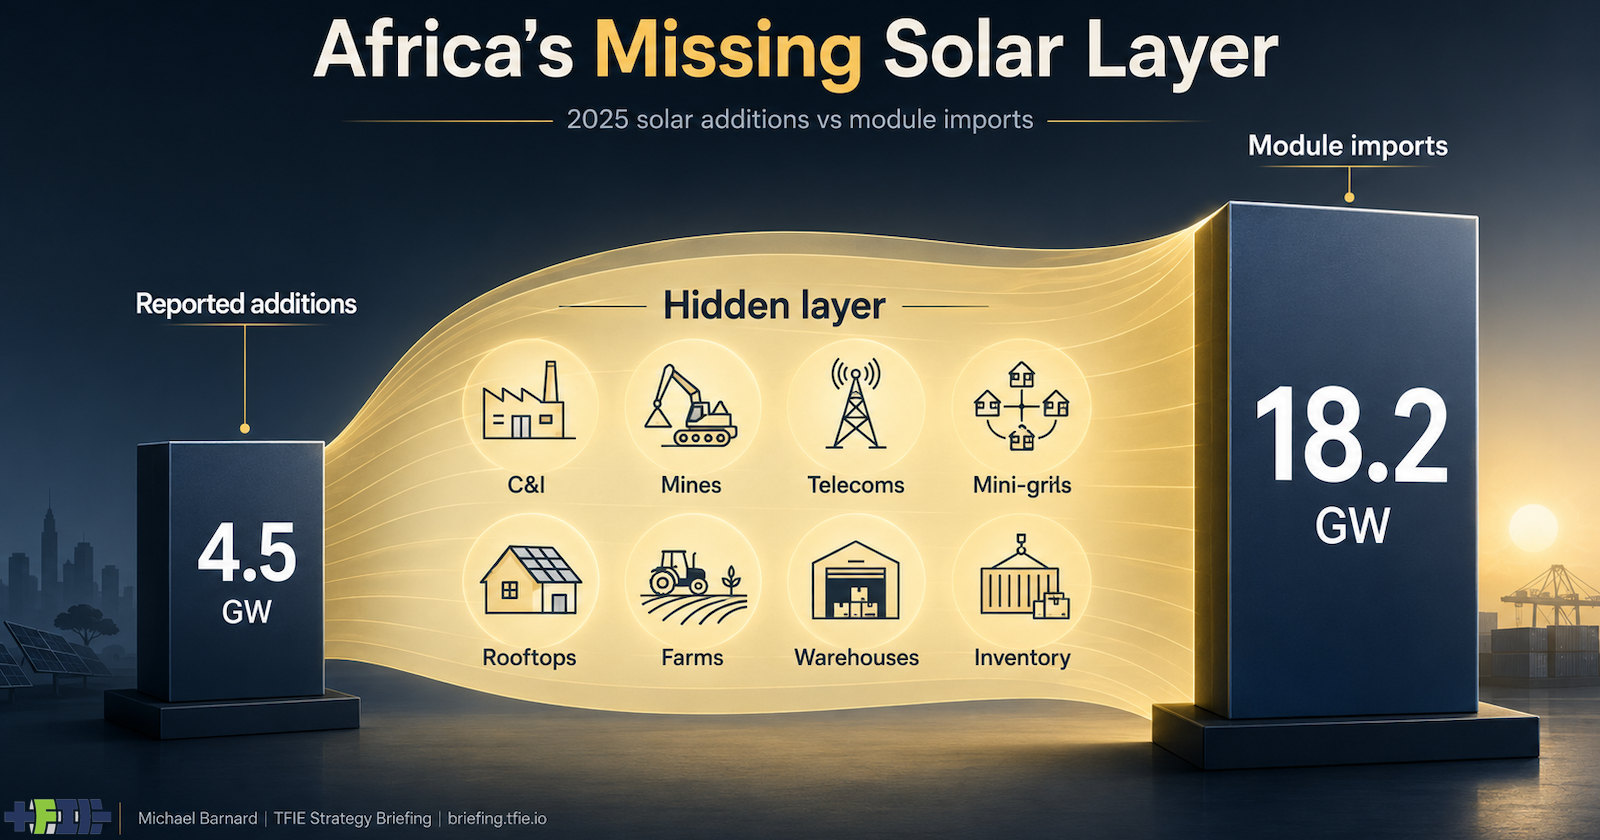
A 4.5 GW reported installation number and an 18.2 GW module import number do not mean 13.7 GW of solar was secretly installed and nobody noticed. That would be too simple, and energy systems rarely reward simplicity. Some of those modules are inventory. Some are headed to projects that have not been commissioned. Some may be delayed. Some may be re-exported. Some may be sitting in warehouses waiting for financing, inverters, batteries, installers, interconnection, or customers.
But the mismatch is too large to ignore. Solar modules are physical objects. They arrive in containers. They sit in warehouses. They get bolted to roofs, fields, factories, telecom sites, mines, farms, clinics, schools, and mini-grid systems. They also often fail to appear quickly or cleanly in formal utility statistics, especially when they are behind the meter, off-grid, fragmented across many small systems, or used mainly to reduce diesel generator hours.
This is the difference between a visible energy transition and a real one. Visible transitions have auctions, grid connection agreements, government ministers in hard hats, and official commissioning reports. Real transitions also have procurement managers cutting diesel bills, mine operators buying power reliability, telecom firms reducing fuel deliveries, farmers installing pumps, and households buying panels because the grid is not worth waiting for. The first is easier to count. The second can move faster.
That is why the 20 GW prediction needs to be tested carefully. If the claim is that Africa will officially report 20 GW of new solar capacity in 2026, that now looks unlikely. It would require reported additions to jump from 4.5 GW to 20 GW in one year, or roughly 4.4 times. That kind of acceleration can happen, but usually where the policy, finance, grid connection, procurement, and reporting machinery is already working at scale.
India is the reference case for that formal pathway. India installed 36.6 GW of solar in 2025, with large-scale projects doing most of the work. India has a national solar market, national auctions, a large grid planning machine, and a reporting structure that can see most of what is happening. Africa does not, because Africa is not a country. It is many markets with very different grids, policies, utilities, currencies, customer bases, and political economies.
Brazil is useful for a different reason. Brazil was expected to add roughly 13 GW of solar in 2025, with distributed generation doing a large share of the work. That matters because customer-side solar can become the main event, not a decorative footnote to utility-scale projects. But Brazil has a clearer policy and reporting structure for distributed solar than most African markets do.
Chile gives us another lesson. Build enough solar and the next problem is not whether solar works. It is how to handle cheap daytime electricity, curtailment, transmission, and storage. In much of Africa, that stage is still ahead. The immediate storage value is more likely to be reliability, diesel displacement, and weak-grid resilience than classic solar curtailment management.
The African pathway is likely to be different from all three. It is more fragmented, more commercial, more Chinese-supplied, more behind-the-meter, more diesel-displacing, more mining-relevant, more mini-grid-heavy, and more annoying for official statisticians. That does not make it less real. It may make it easier to underestimate.
Egypt and Morocco are showing the grid-scale solar-plus-storage version. South Africa is showing the private industrial and constrained-grid version. Nigeria is showing the weak-grid, diesel-displacement, and mini-grid version. Zambia is showing the hydro-drought hedge version. The DRC is showing the mining-power version. Ghana and Botswana are showing industrial and early utility-scale versions. Chad and parts of the Sahel are showing access and small-base growth. Same technology family. Different economic jobs.
For readers who want the deeper professional analysis, I have published the full pathway review on my new professional Substack, Michael Barnard’s TFIE Strategy Briefing. That version includes the project inventory, non-solar renewables denominator check, reference-class comparison with India, Brazil, Chile, and Pakistan, update triggers for 2026, and the verdict summary I will use to track whether Africa’s solar story is showing up as official capacity, physical panel absorption, or some messy combination of both. If you enjoy heavier content, that’s where I’ll be publishing it, so hop over and subscribe. If you read me professionally, including if you have been using me as free due diligence, there’s a modest paywall for the deeper stuff now, but there will continue to be a regular drumbeat of free content, and all deep analysis will include a clear gloss.
The short public version is this: 20 GW of official African solar additions in 2026 looks unlikely. Around 20 GW of physical solar module absorption across the real economy is plausible. That distinction matters because official capacity tables are lagging indicators in weak-grid and distributed markets. Hardware flows, inverter and battery imports, diesel displacement, mining power contracts, mini-grid deployment, and commercial and industrial projects may be better early indicators.
The boom may not be missing. It may just be in the wrong column. If Africa’s solar story surprises people in 2026, it will not be because there was no data. It will be because too many people were looking only at official capacity tables while the hardware was already moving.
Sign up for CleanTechnica's Weekly Substack for Zach and Scott's in-depth analyses and high level summaries, sign up for our daily newsletter, and follow us on Google News! Advertisement Have a tip for CleanTechnica? Want to advertise? Want to suggest a guest for our CleanTech Talk podcast? Contact us here. Sign up for our daily newsletter for 15 new cleantech stories a day. Or sign up for our weekly one on top stories of the week if daily is too frequent. CleanTechnica uses affiliate links. See our policy here.CleanTechnica's Comment Policy
Share this story!
Схожі новини
